How to Draw a Histogram and When to Use It
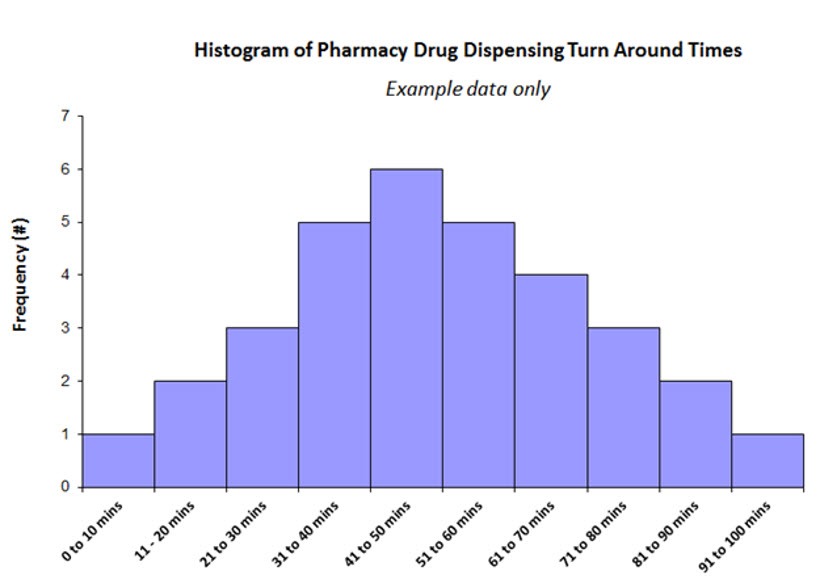
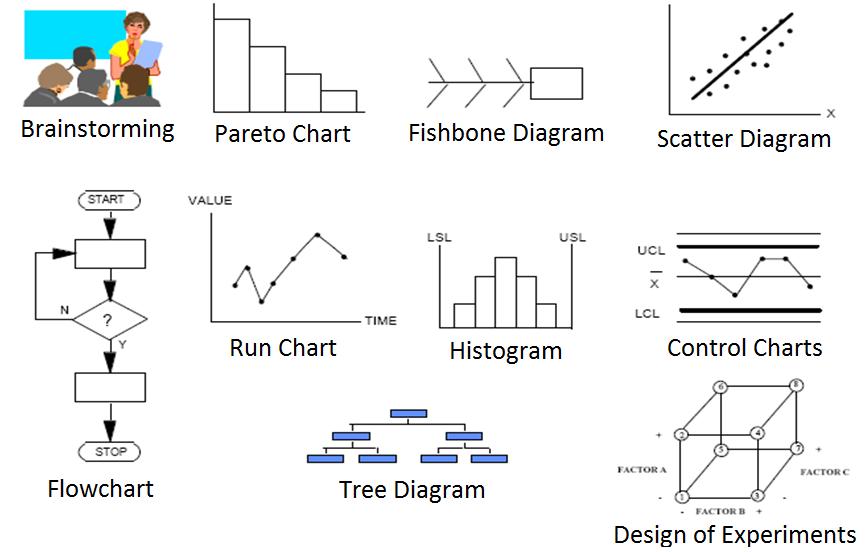
Histograms are like bar charts; they are an approach to show counts of information. A bar graph charts counts against categories; the height of the bar shows the quantity of things in that classification. A histogram shows the same unmitigated factors in "bins". When you make a histogram, you are making a bar diagram [...]


