Root cause analysis is a structured process which is useful in determining the underlying causes behind the certain problem. In other words, we can say that root cause analysis is the process of identifying underlying factors which can be termed as causes of an adverse event. These are contributing factors or causes of a system which can help in determining the root causes and develop actions to sustain corrections. A cause and effect diagram, also called fishbone diagram, is part of root cause analysis. Fishbone diagram for root cause analysis is playing a significant role in the process of solving a problem. Brainstorming helps in identifying the causes and store ideas into useful categories when using the fishbone during a problem solving exercise.
Fishbone diagram for root cause analysis is a method of visual representation of causes and effects of an issue. Brainstorming for possible causes of a problem while using a fishbone diagram, is considered as one of the more structured approaches compared to other ways of brainstorming available. Fishbone diagram is a simple and quick way of understanding the causes in the pursuit of corrective actions. Fishbone diagram is one way of capturing different ideas and stimulating the brainstorming of a team on root causes. Fishbone diagram through a visual display of information help in determining the potential causes for a particular problem and its effects. It is suitable for root analysis or brainstorming in group settings. Fishbone diagram is also useful when quantitative data is available for the analysis. Fishbone diagram has ancillary benefits, in root cause analysis it helps in finding a robust solution by providing an opportunity for thorough exploration of the issue.
Fishbone diagram for root cause analysis
This article will help you take advantage of and use a fishbone diagram for root cause analysis by providing some specific guidelines. The team which is using fishbone diagram in root cause analysis is required to carry out some steps which are as follows:
Fishbone diagram – Step 1
Agree on a specific problem statement and write the problem as effect at the mouth of the fish. Write the problem accurately and clearly. At the first stage, you are required to define the problem as the solution.
Fishbone diagram – Step 2
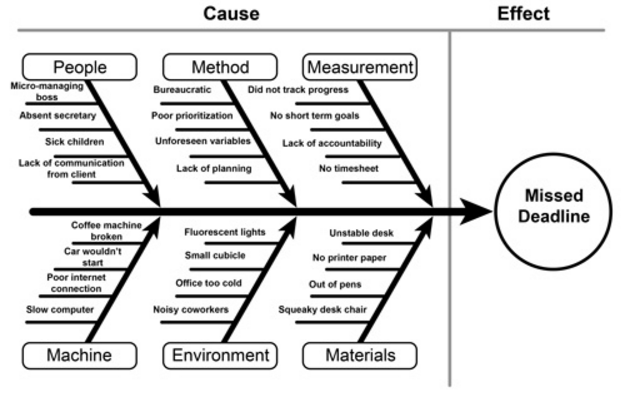
Second steps deals with causes. Here at this point, you should have to agree on broad categories of causes of the problem. Here the expression 5M1E or 6M’s is often used to describe the categories. The 5M1E refer to the first letter of the categories Man, Machine, Method, Material, Measurement and Environment.
Fishbone diagram – Step 3
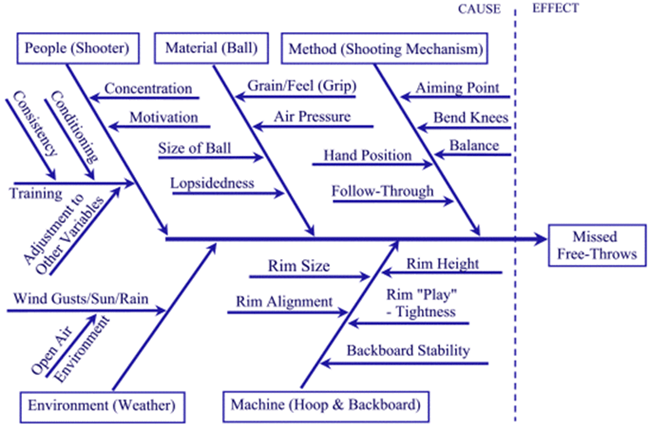
At step 3, you are required to brainstorm all the possible causes of the problem by answering the question why something happens? Write these causes under different predefined categories of causes. Here you are required to create branches of causes like seen in the picture below.
Fishbone diagram – Step 4
At this stage again ask why something happens and create sub cause branches. At this stage, you would be able to create the understanding of a deeper level cause. Understand different causes and help organize them under related cause categories. By developing deep understanding of the cause, you would be able to understand, identify and address root causes to prevent future problems.
Fishbone diagram provides several benefits for process improvement. In root causes analysis fishbone diagram is straightforward and easy. Fishbone diagram involves the whole team in problem resolution and educates the whole team. Fishbone diagram organizes the discussion of the group to stay focused on current issues. It promotes system thinking through visual linkages and prioritizes further analysis and corrective actions.
Example of fishbone diagram for root cause analysis:

Conclusion
In order to use fishbone diagram effectively, you are required to input as much information from the people involved in the analysis as possible. Proper use of information will make the diagram accurate effective and useful. People making use of a fishbone diagram would be able to find the root causes within it. Fishbone diagram comprehends the cause and effect relationship. Although it is complex and complicated, it highlights the concrete reasons which are more relevant than general causes. Through fishbone diagram, you can break down major issues for easily understandable reasons. By following the above-mentioned steps, you would be able to efficiently use fishbone diagram in root cause analysis.
