Use of Voice of Customer in Six Sigma
Voice of Customer in Six Sigma is the procedure used to apprehend feedback from the client to cater the customer with best service and quality. It describes both the told and untold requirements of the customers by various methods, such as, observation, interviews, surveys, reports and complaint logs etc. [...]
CTQ Tree Example and Explanation
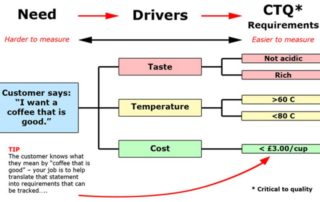
CTQ is the abbreviated term for Critical to Quality. CTQ tree is a Six Sigma tool that is based on diagrams and helps to manufacture and provide superior quality products to customers. CTQ trees are used to interpret extensive and broader customer requirements into particular, precise, litigable and calculable [...]
How to Create a Value Stream Map and the Benefits from It
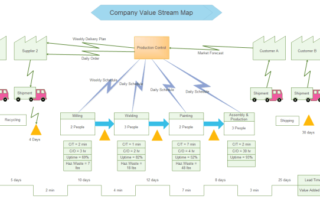
Value stream map is a visual mean to portray and improve the flow of a manufacturing and production process, as well as the information that controls the flow of materials through the process. In this article we will review how to create a value stream map. A value stream map [...]
Five Whys Method for Root Cause Analysis
Root Cause Analysis In simple words, an underlying cause of the problem is referred to as the root cause and the process of finding out the root cause of a problem or an adverse event is known as root cause analysis. Some problems are so rigid and tenacious that [...]
How to Use Andon in Manufacturing and Its Benefits
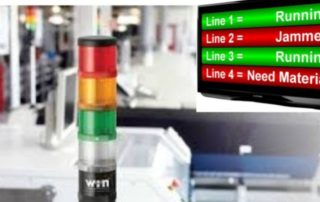
In lean manufacturing, andon refers to state presentation station. It is a visual presentation of ongoing operations and indicates where any action is needed. It is considered as the most effective intercommunication tool as it allows the process to run sleekly without any impediment or jam. Andon is ancient [...]
Statistical Process Control (SPC) in Manufacturing
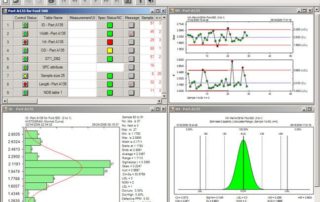
Statistical Process Control (SPC) is an industry-standard procedure for measuring and monitoring quality during the manufacturing process. Quality data as Product or Process estimations are acquired in real-time during manufacturing. This data is then plotted on a graph with predetermined control limits. Control limits are determined by the capability [...]


