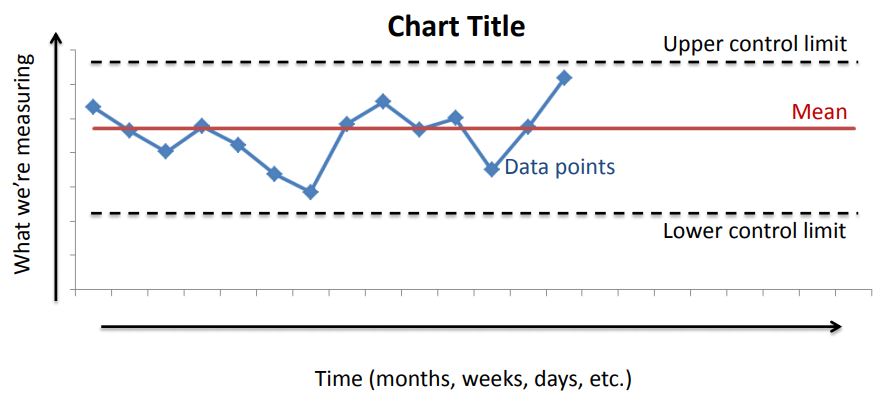
What are Process Control Charts?
Basically ‘Process Control Charts’ are where process data (outputs) are plotted out in the form of graphs or charts in a time-ordered cycle and it is a focused run chart. In simple terms we can say that it is a graph which is used to examine the behavior of a process over time. A process control chart always includes an upper line for the upper control limit (UCL), a lower line for the lower control limit (LCL), and a middle line for the average. Moreover, historical data is used to calculate these lines which both are three standard deviations from the mean.
How to Generate a Process Control Chart?
Process control charts are very useful for leaders and managers for understanding data variation in the results. One needs to follow some guiding steps in order to generate and use a process control chart.
- The first step is to choose a measurement method. A process control chart gives us the opportunity to evaluate given data and trends over time. Therefore, we must be very clear in selecting what data will be collected by us. Process control charts use different forms of data including variable data and attribute data. Now a usual mistake made by some organizations is to overlook validation of input data used in the control chart to ensure it is correct.
- Thus, our second step is to ensure the accuracy of our measurement system, because we will make wrong decisions gauges and providing incorrect data. An organization must perform regular evaluations on its measurement system.
- After that the third step is to determine where we will store the data. In this aspect, the best method is to choose a platform which possesses control chart abilities. It allows stakeholders to access the information in a live chart where history of the process results is created over time.
- Our fourth step will be to start collecting data and to do so a plan must be developed to assemble data at a determined frequency. It must be kept in mind that the people should be properly trained for data collection, measuring and charting the outcomes.
- Once we have acquired our control chart along with some data, then the fifth step is crafting and documenting our reaction plan. It is extremely important to have a clear reaction plan that provides a direction on what actions to take when a process is determined as out-of-control or near out-of-control condition. In this regard, there are some useful tools such as flow charts, the “Western Electric rules,” and other decision trees that can be used.
- Furthermore, we will calculate control limits as our sixth step after we begin collecting data which is generally done with 20 to 25 data points.
- Our seventh step will be to evaluate whether our process is up to the mark. An out-of-control process can take place in different forms. For example, one point falling outside of the 3-sigma upper control limit or lower control limit. Moreover, when two out of three repeated points are in the area that is two standard deviations from the mean, then it also indicated an out-of-control process. These kinds of conditions should set off a defined reaction plan as they point toward ‘signals’ that some special cause is behind them and have triggered abnormal conditions of the process.
- Once an out-of-control condition takes place then the eighth step is to classify its root cause. The root cause of the variation can be identified through various tools of which DMAIC and PDCA often is used. In case when a chart is “in control” and an organization’s performance still doesn’t fulfill its customer’s requirements or business goals, then we refer to it as ‘common cause’ variation. There are different elements that contribute towards common cause variation and generally these are various factors that are part of our system and its capability. These will have to be improved further through a continual improvement projects if required.
- Last but not the least, our ninth and concluding step in the creation of a process control chart is implementing action plans for improving the process. An organization can take corrective actions in order to solve the problem and improve the process when the true cause of the variation has been identified. We must also be aware of the fact that the implementation of a process control chart is not that complex; nevertheless, in order to make it effective an organization need to be very vigilant.
